Showing posts with label Nifty. Show all posts

Thursday, November 10, 2016

Nifty 10-11-2016 EOD analysis

Nifty seems to have completed two segments of up move from the low reached on Wednesday morning. This can be viewed as either a-b-c or 1-2-(i)-? according to Elliott wave analysis.

Following is the 5 min chart of Nifty with Elliott Wave labels.


8521  8497 … is 38%-50% retrace of the last rise from …… 8396 to 8598
80% is – 8436
If strength to return again, it should be around 8521  8497
Weakness gets confirmed Below 8497 OR 8436


Sunday, November 6, 2016

Nifty 07-11-2016

Daily Nifty chart


It appears like A,B of the correction from the peak 8963 is complete. B was a flat correction. This signifies that the impending C is going to be a strong down move. Breaking down the C shows that it has completed 1&2 and 3 is in progress, or it is almost done at the low of Friday with the move between 138.2% 161.8% 8376. Now we can expect the 4th wave to move up. It should not break the low of the 1st wave at 8550.25 which will invalidate this wave count.

Further on 4th wave can take anywhere between 3 -4 days to complete. (is that a coincident that 3 days from now is wednesday when the US election results are out?) Then a further dip for the completion of 5th wave may be on cards.

--<<8321-8342 << 8502 >> 8545-8555 >> 8604++

C wave in the daily chart:

Wednesday, October 19, 2016

Nifty - Piercing Pattern

Nifty on 17th October 2016 at 15:30 has formed a piercing pattern. Following this on 18th Nifty opened gap up, and continued upward journey.


This continued for 9 consecutive candles of positive closing. At the end we could see a partial shooting star followed by a bearish engulfing. This brought a halt in the hourly time frame. Looking at the +ve divergance in hourly 9 RSI chart, this halt many not be a very deep one. It might just be a time correction for all the averages to catch up. Also for the 9 RSI to cool off a bit before the next move.


Gann date - Yesterday happens to be the 25th day of the down move from the top. It is +/- 1 day from 26 which is half of 52, an important Gann number. This gives more weight to this turning. This might be the end of 4th wave as seen in the daily chart.
 

Friday, August 26, 2016

Nifty intraday 26-08-2016

Our earlier views on Nifty about the triangle formation became invalid. I'll write a detailed note on this one over the weekend (Impact of the per-conceived notion on the Elliott wave analysis )

The fresh look at the hourly chart shows that we are either in 'C' of the 4th wave or on the 3rd wave of the bigger fall. For now we will go ahead and perceive the 'C' wave and will look into the 3rd wave possibility only if this wave does not end near 8410 region.

Nifty hourly chart:


Thursday, August 25, 2016

Nifty EOD 25-08-2016


Nifty 1 min chart shows clearly how this a-b-c up move has played out. This over shoot the triangle trend line, just to complete the 'D' wave. And return back into the trend line, indicating the false breakout!

Nifty 1 min chart zoomed in:


Nifty 1 min chart showing the entire triangle formation:

Now let us step back and observe the hourly chart and hourly 9 RSI chart:

 Nifty hourly chart with 9 RSI
We can observe the triangle pattern in the RSI data as well!


Nifty intraday 25-08-2016

Nifty hourly chart shows a possible triangle completion. Current upmove from the low of 8590 appear like the next leg of the up move, a part of the 5th wave up. This has a potential to go up near 8880 range. However there are lot of resistance clusters above 8700 range. Today being the expiry day, market may swing dramatically in either direction!

We need to closely observe the breakout region near 8660 - 8680 range. If comfirtably moves above this then the breakout is confirmed. It may also spend more time in the region resting on the downward sloping upper trend line of the triangle in a pull back. However moving below 8650 will be a concern for this breakout.

Nifty hourly chart with Elliott Wave analysis:


Nifty hourly chart with 9 RSI:


Wednesday, August 24, 2016

Nifty end of the day 24-08-2016

Nifty after completing a complex correction involving abc-x-abc has moved swiftly in 5 wave form above the channel line starting at 2:07 pm. At the closing Nifty has completed a minor 5 wave up move followed by a minute 5 wave down move which represents wave 'a'. Then a very small 7 point upmove. This could be wave 'b' or it might still be going on tomorrow morning at the opening.

Two options can be seen at the opening tomorrow:
1. A very small upmove which should be contained below 8659.90 (beginning of the down move) then a swift down move may follow. That will complete the correction for the rise from 8620.90 to 8659.90. Then further upmove may commence.

2. A very swift down move which may go near 8642 which is 61.8% fibonacci extension or 100 at 8636.  That will complete the correction for the rise from 8620.90 to 8659.90. Then further upmove may commence.

Nifty intraday update 24-08-2016

Nifty seems to have not completed the correction before lunch (Nifty intraday 24-08-2016), but it was only one part of the complex correction abc-X-abc.

Nifty chart:


Nifty intraday 24-08-2016

Nifty seems to have completed a correction in the form of a-b-c for the rise from 8580.95 to 8661.05. This 'c' wave may complete near 8616 (or is already completed?). This may also go up to 8610.9 which is 61.8% fibonacci retracement level for the rise. At the completion this also looks like a pole and flag formation.

Nifty 1 min chart:


Tuesday, August 23, 2016

Nifty intra day 23-08-2016

Nifty seems to have completed a complex correction (in 5 min chart) a form abc-X-abc.

Nifty 5 min chart with Elliot wave analysis:


Tuesday, July 12, 2016

Nifty intrady observation 12-07-2016


On a daily 9 RSI chart Nifty appears to be forming a -ve divergence. Now we need to observer hourly chart.


On the hourly 9 RSI chart also we can see it is ready to form -ve divergence if market closes below 8500 at 10am and then starts come down from that point. Now let us observe 5 min chart.


In a 5 min chart Nifty appears to have formed a 5 wave up move starting from 8288 to 8503.45. A breaking of 8443 which is the end of 4th wave will confirm this. Or breaking of 80% of the up mvoe from 8443 to 8503 at 8455 will give clues to this view.


On the contrary a move above 8503.45 will negate this view.

Wednesday, March 23, 2016

Nifty intra day update 23-03-2016

Nifty intra day update:
Nifty seems to be doing a FLAT correction from
7713-7644 = a
7644-7727 = b
7727-76xx = c

This view gets negated with a move above 7727 or a deep correction beyond 7540.

I'm planning to take a long position
1. A move past 7730 OR
2. Near 7640 with 20 points SL.

Nifty spot 5 min chart that I'm tracking:

Tuesday, March 22, 2016

Nifty 22-03-2016

Today I exited the position that I have taken yesteday @ the break of the channel (upper line). The idea was that 5 minor Elliott waves were observed clearly and the next leg will be a correction, once the correction is complete then re-enter the trade. Although my exit point was not correct, it should have been near the target 7713, the circled area instead of the actual exit 7679 as marked in the chart.

I was not able to enter the long position as marked in the chart. Now again to enter the long I have to wait for a minor correction and once it completes I'll observe the depth of the correction and then take a call either to enter the long or wait or to re-look into the situation and consider a short. This can be done during the market tomorrow.

Nifty 5 min chart:


Nifty 21-03-2016

Trend was up as NS (Nifty Spot) was above DHema. NS made a high in the morning near 7662 and corrected in an a-b-c form within a channel. Around 1:45pm market completed the correction and started the move up. The whole thing appears like the impulse with 1-2-3-4 are done and 5th is pending. The complete move is started from 7480 area. If wave 5 = wave 1 then this may move up to 7627 + (7566-7480) = 7713.

I have entered the trade near 7651 after the NS broke the line connecting the top of 3rd wave and the top of wave 'b'. Ideally I should have entered near the channel bottom near 7630 area with a smaller stop loss. This should have allowed me to take higher quantity compared to my actual entry point where my SL has to be big. Hence this reduced the number of quantity that I could buy.

This is in continuation with the weekend post "How not to trade"

Nifty 5 min chart :


It is observed that at the end of the day the target for the 5th was achieved. Hence the trade should have been closed. However the stop loss was on trailing basis and market has not yet come down from the top before the close. Hence the trade was not closed. Long is carry forward to the next day. Elliott wave observation perspective this is not a wise move as the 5th was over unless it is going to be sub-dividing. (the bigger 3rd wave is still on, if this minor 5 waves are done, then at the maximum the correction might go near 80 points - bigger than the two corrections which are part of the just concluded 5 waves 40 & 35. )

Sunday, March 20, 2016

How not to trade

Following is the actual trading journal for the week of March 14-18, 2016.
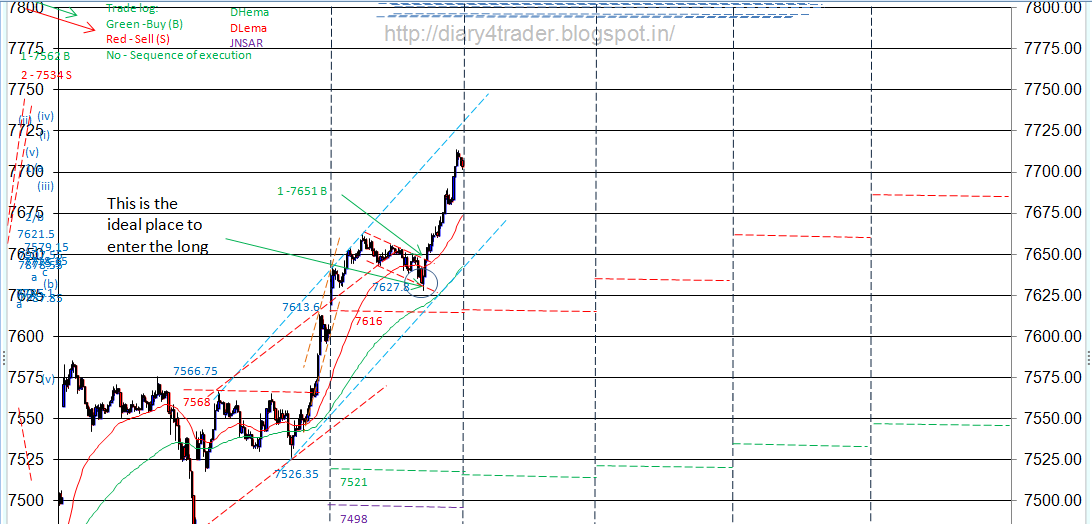
  1. Green indicates long entry. Number '1' indicates this is the 1st order for the week/day. 7562 is Nifty sport price at the time of entry. 'B' indicates it is Buy. Green also indicates Buy.
  2. Red indicates it is a Sell. 'S' indicates it is a Sell.
  3.  Vertical line indicates the start and end period of the day.
  4.   Indicates the DLema for the day.
  5. DHema for the day.
My goal with this chart is to analyse the trades visually and take a note of all the errors. This should help me to improve myself over a period of time.

To increase the success in trading :
1. Reduce the no. of errors
2. Gain insight into the market

To better #1, there are two ways to achieve it.One is to reduce the overall number of trades and the other is to reduce the number of wrong trades. This will invariably increase the number of successful trades. One has to sit patiently and wait for a good risk reward trade to appear on the screen.  For this one need to gain more insight into the market movement and analyse it with a technical analysts eye.

For ex: In the below chart we can see
1. When the market 7553 DHema on 14th, the next day all rise should be used to sell Nifty as long as it stays below DHema with DHema as the SL or 20 point as SL. (This is strictly for intraday, for carrying this short into next day market has to move below DLema and close below it.)
2. Another low risk entry point was when Nifty moved below DLema-30 near 7405 area. Enter long with 30 points as SL. This was moving back above DLema and closing above it. This will eventually go above DHema. So wait for it.


On the lighter side, If I had just reversed the color of my trade entries from green to red then I would have just achieved spectacular profit :-)

Please note: None of these are any recommendations. They are just learning's and notes from my observations.

Tuesday, February 23, 2016

Nifty intra day update 23-02-2016

From the top of 7252.20 to the low of 7153.50 a 5 waves seems to be done (unless 5th wave is subdividing), in such case it may go below the current low.
Now we need to watch the retracement of the fall from 7252 to 7153. Weekness is to return it should be around 7205 or 7214 which is 50 to 61.8% retrace.
Strenght gets confirmed above 7232 which is 80% of the retace.

Also to monitor is the fast retrace of the fall from 7178.9 which is the top of the 4th wave in the current fall. This will further guide whether the 5 waves are done or is subdividing.

Intra day long with 7143 (Day low -10) may be a good risk reward trade.


Monday, February 22, 2016

Nifty 22-02-2016 Elliott wave

In the 5 min chart Nifty appears like making a final 5 waves of the 'C' of [iv] wave up.
This minor 5th wave appears like making an ending diagonal, of which a-b-c-d are completed and the final 'e' is pending. This 'e' might or might not reach the converging trend line and break in the down side. If this is not breaking the upward trending (lower trend line) before lunch time on 23-02-2016 then we can consider that the above view is negated.

Nifty 5 min chart for 22-02-016: