Saturday, March 25, 2017
IOC Indian Oil Corporation - Price action analysis
Stock price of companies in the same industry generally move in the same direction in normal market conditions.
Today when I analysed the price action move of HPCL, I was curious to watch IOC. The movements are similar!
IOC Monthly chart:
Weekly chart:
Daily chart;
Today when I analysed the price action move of HPCL, I was curious to watch IOC. The movements are similar!
IOC Monthly chart:
Weekly chart:
Daily chart;
Hindustan Petroleum price action analysis
Hindustan Petroleum chart analysis:
Monthly chart:
Hind Petro made a high at 583 and a swing low of 410. The range seems to be set in here for next couple of months.
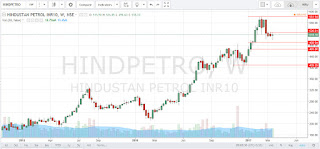
Weekly chart:
If the current weeks low 498.60 is protected then it may move up for sometime. There may be a strong support near 490, from where the quick up move started.
Daily chart:
There is a doji and next candle is having lower high & lower low. So there is still a downward bias. It may re-test the 490 zone before moving up again.
Piramal Enterprises Limited - follow up
Earlier I had noted a possible 'B' wave correction as a triangle, ending near the high of 1920 for Piramal Enterprises Limited.
So far the development after that is indicating weakness in the up move. If we observe the price action movements, the down move though not gathered momentum yet but indicates the downwards bias. Large bearish engulfing candle formed yesterday indicates the same. Move below 1800 will increase the downward momentum.
From the price action movement in PEL it appears that the earlier view of B wave ending near 1920 is valid.
United Spirits Limited - Follow up
I had written a possible opportunity in United Spirits Limited on 23-03-2017, following it up with yesterday's move.
Opened at 2193. Open and low are same. Opened above the half of the previous candle. These all indicate the stock is currently in the up trend. Another minimum requirement for the up trend is higher high and higher low for the subsequent candles. This is also meet.
Here is the daily chart of United Spirits Limited :
Thursday, March 23, 2017
Aurobindo Pharma
I had analysed Aurobindo Pharma on 22-07-2016 when there was a news about its buy of Teva Pharmaceutical. This post shows how I label (Elliott Wave) the moves. Since then I have been following its movements.
There are two possibilities that I can see:
1. The down move which ended in December 2016 might have completed the 'C' and started the next up move.
2. Wave 'C' is still not over but a correction to the down December down move is going on. There might be another down move probably near 580 zone.
As of now the minor movements in daily chart shows weakness in the up move. There might be few days of down move expected.
Aurobindo Pharma weekly chart with Elliott wave labels:
Aurobindo Pharma with support and resistance marked for price action trading:
United Spirits - is giving a long opportunity?
Yesterday (22-03-2017) United Spirits Ltd (USL) has formed a doji candle. This is indicating the indecisiveness, where both sellers and buyers are trying their best to move the stock in their direction but no one is able to gain an upper hand. This is followed by a large green candle which opened above yesterday's closing. The low was above the mid of the Doji. The close of this candle has engulfed the last two candles indicating the strong come back of the buyers.
USL United Spirits Limited daily chart:
USL United Spirits Limited daily chart:
Subscribe to:
Comments (Atom)


