News in business-standard.com : Hyderabad-based Aurobindo Pharmaceuticals is planning to raise funds via a share sale to fund the acquisition of Israel-based Teva Pharmaceutical’s European assets, if its bid is accepted by this month.
More here:
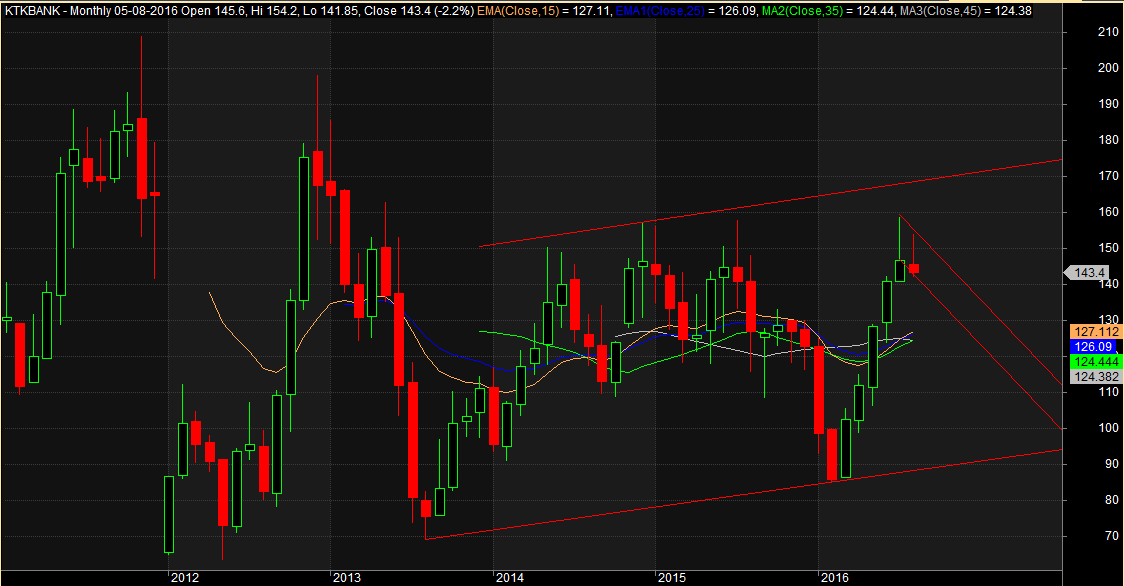
Now let us look at the chart of Aurobindo Pharmaceuticals. It appears it had completed a massive up move which topped around 892 region. Then followed a clear 5 wave down move (as per Elliott Wave analysis). This down move can be marked as either A or 1. Then we saw a up move 830 region. Again a minor correction in the form of clear a-b-c wave. Again a up move has commenced. The overall structure appears like a corrective up move for the fall from 892 to 580 region. If yes then this upmove may face resistance near 870 to 900 region and next set of down move may start. Will it happen this way?
Daily chart of Aurobindo Pharmaceuticals:
 Weekly chart:
 Daily chart:
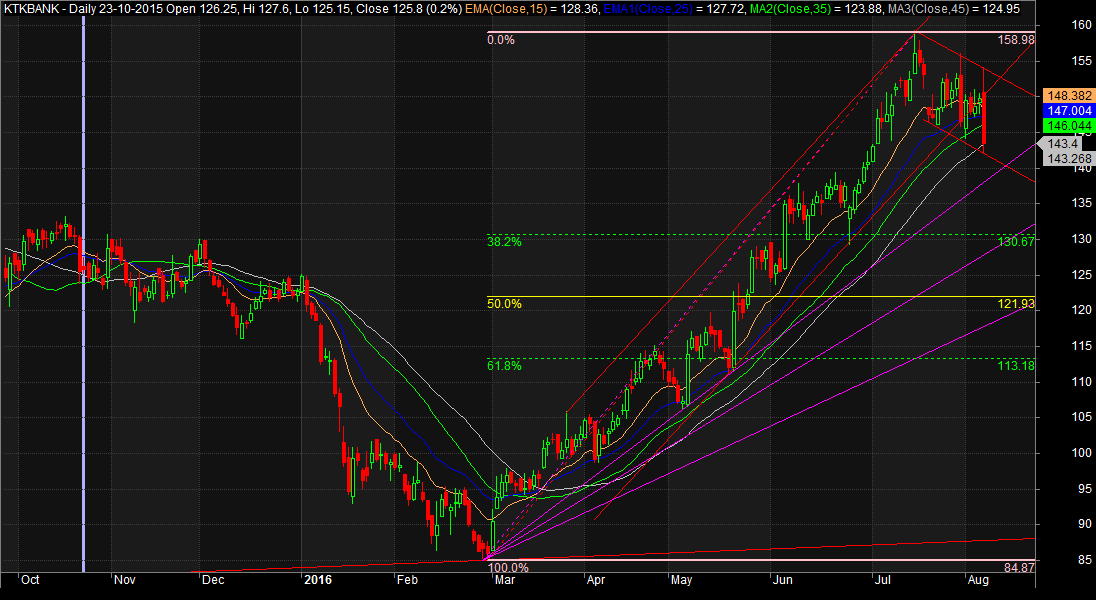
 Daily chart with fibonacci retracement levels: