Tuesday, February 23, 2016

Nifty intra day update 23-02-2016

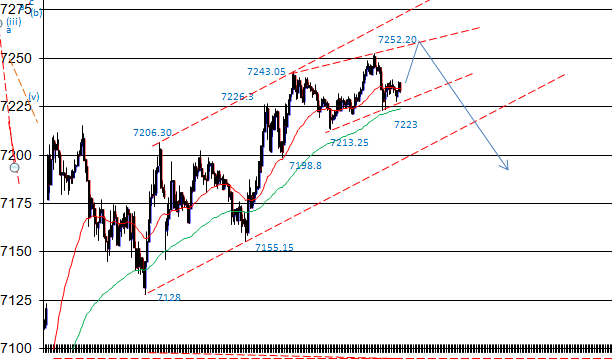
From the top of 7252.20 to the low of 7153.50 a 5 waves seems to be done (unless 5th wave is subdividing), in such case it may go below the current low.
Now we need to watch the retracement of the fall from 7252 to 7153. Weekness is to return it should be around 7205 or 7214 which is 50 to 61.8% retrace.
Strenght gets confirmed above 7232 which is 80% of the retace.

Also to monitor is the fast retrace of the fall from 7178.9 which is the top of the 4th wave in the current fall. This will further guide whether the 5 waves are done or is subdividing.

Intra day long with 7143 (Day low -10) may be a good risk reward trade.


Monday, February 22, 2016

Nifty 22-02-2016 Elliott wave

In the 5 min chart Nifty appears like making a final 5 waves of the 'C' of [iv] wave up.
This minor 5th wave appears like making an ending diagonal, of which a-b-c-d are completed and the final 'e' is pending. This 'e' might or might not reach the converging trend line and break in the down side. If this is not breaking the upward trending (lower trend line) before lunch time on 23-02-2016 then we can consider that the above view is negated.

Nifty 5 min chart for 22-02-016:

Biocon 22-02-2016

Biocon appears like completed an a-b-c Elliot wave correction. This could be the end of the correction or it could simply be the 'a' wave. In either case the follow-up after this is another impulse upwards or a correction as in a FLAT which again is upwards and may go all the way upto 540 or 570 region.

Daily Ellioet wave chart:

Thursday, February 18, 2016

Nifty intra day 18-02-2016

Nifty Elliott wave
Nifty seems to be making a 4th wave up in daily time frame.
On the hourly time frame it seems like forming a-b-c of which a & b waves are over. Currently it is moving up in wave 'c'.
5 min chart below shows that Nifty might have completed waves 1,2 and 3 at todays high sofar. Now it is forming the 4th wave.
As the wave 2 is very deep, based on alternate guidelines wave 4 may be very shallow. But this may be time consuming.
This view will be negated once the market moves below 7057.55 which is the top of wave 1.

Nifty 5 min chart:

Wednesday, February 17, 2016

Biocon 17-02-2016 daily


Biocon is correcting in a channel. If it breaks on the up side, it may go up with speed. The correction so far can be viewed as zig-zag in Elliott wave. The channel break out will produce a good trade-able move.

TCS - 17-02-2016 weekly


Atul Auto - 17-02-2016 daily chart

It looks like Atul auto is forming a triangle. It is final leg where it has completed a & b. Now the final leg of this 'E' wave, which is 'c' is in progress. This may complete near 400.

If we see the length of 'a' => 584.60 - 459.05 = 125.55
if a=c then 'c' => 485 - 125.55 = 359.45

c=a * 0.618 (minimum) = 485 - (0.618x125.55) = 407.40

So 407 to 360 can be the range to enter into this for a spectacular 5th wave up. Which may go up towards 850 to 950 range if holds the triangle boundaries.


Friday, February 12, 2016

Nifty EOD analysis for 11-02-2016

Nifty made minor bounces and mostly running corrections in the recent down move. This is speaking about the strength of the down move. At a higher time frame nifty is forming 3rd wave of Elliott Wave. This is very impulsive in nature. Minor & Minutte waves of this 3rd wave are currently running the 3rd of 3rd of 3rd. Of this inner most 3rd seems to be over at the bottom of yesterday's move @ 6960.20. 2nd wave of this time frame has done a running correction. Hence possibly the 4th may be a flat. Hence we need to observe the bounce carefully.

Observe the retracement from 7096 to 6960. Any weakness is to return it will be around 7026 to 7041(50 to 61.8% retracement). Strength will be above 7065, 80% of the retracement. A short trade near 61.8%  with 80% as the stop loss may be rewarding.

Nifty hourly chart:


Nifty 5 min chart:


Retracement table:

Monday, February 8, 2016

Nifty 08-02-2016 EOD

Nifty might be forming a larger FLAT of which the 'b' wave might be in progress as of now. This may take it anywhere near to earlier low 7240-50 range or even slightly lower than that. Then a bounce may occur towards 7600 area. If that happens then it will open up another down much below 7200 area to complete the next leg of major down move.

Nifty hourly chart:


Nifty 5 min chart:

Nifty 08-02-2016

Nifty seems to be forming a triangle/wedge from the bottom of 7350.80 to the recent high of 7510.95.
Of this the final leg which started from 7450 in itself is again a wedge. This seems to have completed its a-b-c-d. Now the final 'e' seems to be pending. once it crosses the height 7510.95 this will be completed. Then on the break of 7486.90 a short might be rewarding. This will give approximately 100 points move.

Friday, February 5, 2016

First post

This is my first post. I'll be using this space to share mostly my trading ideas. Whenever time permits I'll also be sharing some of my investment ideas. I'll take atmost care while publishing the posts. However I would strongly urge individuals who is using the info to make their own analysis before acting on it. I'll not be responsible for any loss arising out of your action. Good luck. Happy wealth creation. - Administrator