Showing posts with label Intraday. Show all posts

Friday, August 26, 2016

Nifty intraday 26-08-2016

Our earlier views on Nifty about the triangle formation became invalid. I'll write a detailed note on this one over the weekend (Impact of the per-conceived notion on the Elliott wave analysis )

The fresh look at the hourly chart shows that we are either in 'C' of the 4th wave or on the 3rd wave of the bigger fall. For now we will go ahead and perceive the 'C' wave and will look into the 3rd wave possibility only if this wave does not end near 8410 region.
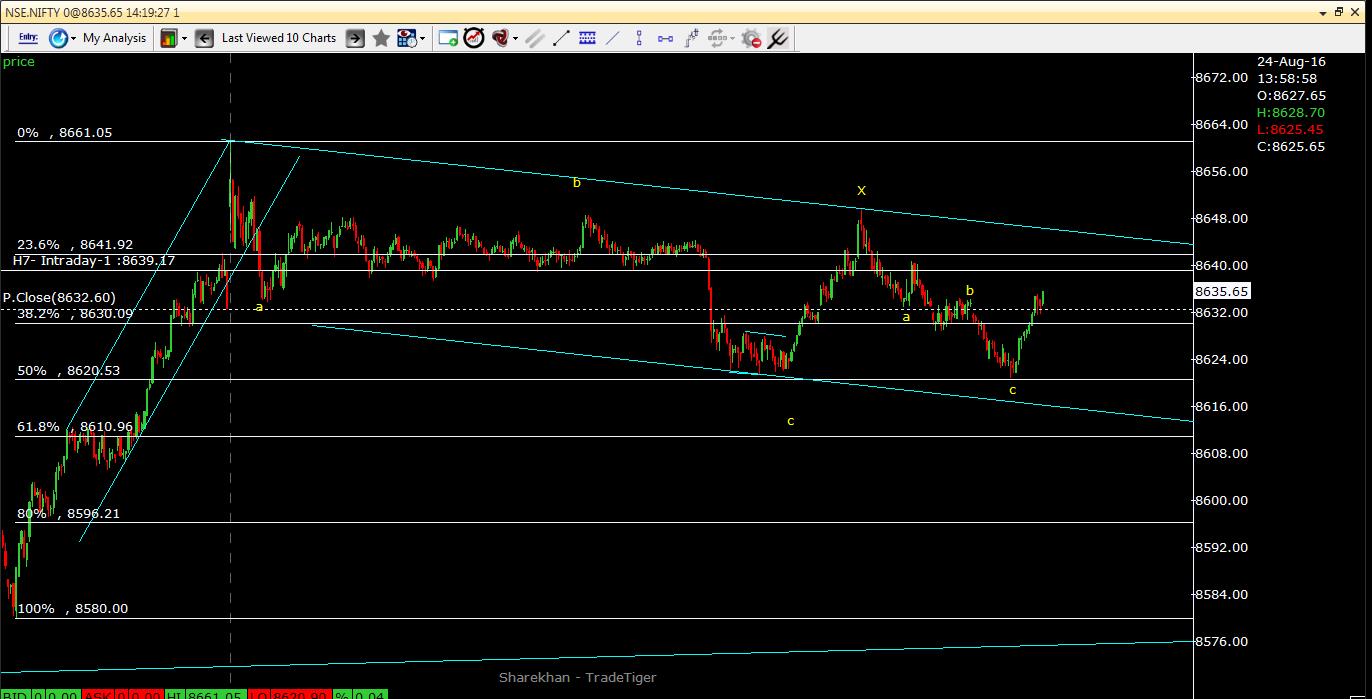
Nifty hourly chart:


Thursday, August 25, 2016

Nifty EOD 25-08-2016


Nifty 1 min chart shows clearly how this a-b-c up move has played out. This over shoot the triangle trend line, just to complete the 'D' wave. And return back into the trend line, indicating the false breakout!

Nifty 1 min chart zoomed in:


Nifty 1 min chart showing the entire triangle formation:

Now let us step back and observe the hourly chart and hourly 9 RSI chart:

 Nifty hourly chart with 9 RSI
We can observe the triangle pattern in the RSI data as well!


Nifty intraday 25-08-2016

Nifty hourly chart shows a possible triangle completion. Current upmove from the low of 8590 appear like the next leg of the up move, a part of the 5th wave up. This has a potential to go up near 8880 range. However there are lot of resistance clusters above 8700 range. Today being the expiry day, market may swing dramatically in either direction!

We need to closely observe the breakout region near 8660 - 8680 range. If comfirtably moves above this then the breakout is confirmed. It may also spend more time in the region resting on the downward sloping upper trend line of the triangle in a pull back. However moving below 8650 will be a concern for this breakout.

Nifty hourly chart with Elliott Wave analysis:


Nifty hourly chart with 9 RSI:


Wednesday, August 24, 2016

Nifty end of the day 24-08-2016

Nifty after completing a complex correction involving abc-x-abc has moved swiftly in 5 wave form above the channel line starting at 2:07 pm. At the closing Nifty has completed a minor 5 wave up move followed by a minute 5 wave down move which represents wave 'a'. Then a very small 7 point upmove. This could be wave 'b' or it might still be going on tomorrow morning at the opening.

Two options can be seen at the opening tomorrow:
1. A very small upmove which should be contained below 8659.90 (beginning of the down move) then a swift down move may follow. That will complete the correction for the rise from 8620.90 to 8659.90. Then further upmove may commence.

2. A very swift down move which may go near 8642 which is 61.8% fibonacci extension or 100 at 8636.  That will complete the correction for the rise from 8620.90 to 8659.90. Then further upmove may commence.

Nifty intraday update 24-08-2016

Nifty seems to have not completed the correction before lunch (Nifty intraday 24-08-2016), but it was only one part of the complex correction abc-X-abc.

Nifty chart:


Nifty intraday 24-08-2016

Nifty seems to have completed a correction in the form of a-b-c for the rise from 8580.95 to 8661.05. This 'c' wave may complete near 8616 (or is already completed?). This may also go up to 8610.9 which is 61.8% fibonacci retracement level for the rise. At the completion this also looks like a pole and flag formation.

Nifty 1 min chart: