Hindustan Petroleum chart analysis:
Monthly chart:
Hind Petro made a high at 583 and a swing low of 410. The range seems to be set in here for next couple of months.

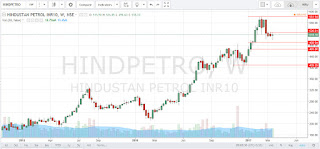
Weekly chart:
If the current weeks low 498.60 is protected then it may move up for sometime. There may be a strong support near 490, from where the quick up move started.
Daily chart:
There is a doji and next candle is having lower high & lower low. So there is still a downward bias. It may re-test the 490 zone before moving up again.

Monthly chart:
Hind Petro made a high at 583 and a swing low of 410. The range seems to be set in here for next couple of months.

Weekly chart:
If the current weeks low 498.60 is protected then it may move up for sometime. There may be a strong support near 490, from where the quick up move started.

Daily chart:
There is a doji and next candle is having lower high & lower low. So there is still a downward bias. It may re-test the 490 zone before moving up again.

No comments:
Post a Comment